上QQ阅读APP看书,第一时间看更新
How to do it...
This section walks through the steps to calculate the cost function.
- Set a learning rate value of 0.1 to incrementally change the weights and bias until a final output is selected using the following script:
learningRate = 0.1
- Initiate a Python list called allCosts using the following script.
allCosts = []
- Create a for loop that will iterate through 100,000 scenarios using the following script:

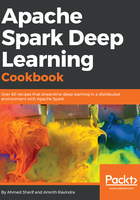
- Plot the cost values collected over the 100,000 iterations using the following script:
plt.plot(all_costs)
plt.title('Cost Value over 100,000 iterations')
plt.xlabel('Iteration')
plt.ylabel('Cost Value')
plt.show()
- The final values of the weights and bias can be viewed using the following script:
print('The final values of w1, w2, and b')
print('---------------------------------')
print('w1 = {}'.format(w1))
print('w2 = {}'.format(w2))
print('b = {}'.format(b))